Using Process Explorer as the debugging tool: Difference between revisions
Jump to navigation
Jump to search
(add more tvar's) |
(reuse tvar's) |
||
| Line 14: | Line 14: | ||
<gallery widths="200px"> | <gallery widths="200px"> | ||
File:Process Explorer 01.png|<translate>Screen 1: Point Process Explorer to debug symbols</translate> | File:Process Explorer 01.png|<translate>Screen 1: Point Process Explorer to debug symbols</translate> | ||
File:Process Explorer 02.png|<translate>Screen 2: Select ''Properties…'' of Miranda process</translate> | File:Process Explorer 02.png|<translate>Screen 2: Select <tvar|properties_menu_item>''Properties…''</> of Miranda process</translate> | ||
File:Process Explorer 03.png|<translate>Screen 3: Select main thread and click ''Stack''</translate> | File:Process Explorer 03.png|<translate>Screen 3: Select main thread and click <tvar|stack_btn_name>''Stack''</></translate> | ||
</gallery> | </gallery> | ||
Revision as of 21:01, 5 April 2018
Template:Languages/Process Explorer
If Miranda NG freezes, hangs up or consumes CPU without a reason, you may investigate the case using Process Explorer tool.
All you need to do is the following:
- Download Process Explorer from Microsoft website. Run procexp.exe and accept license agreement by clicking Agree button.
- Download Miranda NG debug symbols corresponding to your current Miranda version. Extract the symbols to any directory on your computer (Miranda main folder will do).
- Point Process Explorer to the debug symbols using Options → Configure Symbols (Screen 1).
- In Process Explorer pick up Miranda process, right-click it and select Properties… (Screen 2).
- On Threads tab in the window that will pop up select the main thread. Under Windows 7 its name looks like miranda32[64].exe!wWinMain (Screen 3).
- Clicking Stack button will open the window containing the information which you may copy and attach to your bug report.
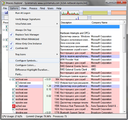
Screen 1: Point Process Explorer to debug symbols
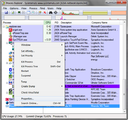
Screen 2: Select Properties… of Miranda process
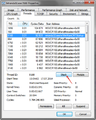
Screen 3: Select main thread and click Stack


